India’s economic indicators: How to read GDP, CPI and IIP together
India’s economic indicators can tell three different stories about the same month without any of them being wrong. A factory may be producing more goods, its customers may be paying higher prices, and a business selling services may be expanding faster than either. GDP, the Consumer Price Index and the Index of Industrial Production measure different parts of that picture.
The Ministry of Statistics and Programme Implementation has announced a data users conference in Mumbai for November 23 on the new series for all three measures. The notice appeared on November 20 in the statistics ministry’s November announcements. For anyone opening a government data table to prepare a presentation, the immediate issue is practical: which series belongs in the chart, and what exactly can you compare?
India’s economic indicators answer three different questions
Start with the question a business wants to answer. A retailer budgeting for changes in consumers’ purchasing power might first look at CPI, a measure of how prices in a representative consumer basket change. A manufacturer investigating a change in factory activity has a better starting point in IIP, which tracks industrial output. Neither measure on its own gives the value of everything produced across the economy.
GDP takes the broader view. A GDP release can present values at current prices or adjusted for price change. A business comparing the size of a market in rupees may care about current prices. A reader asking how much economic activity grew after accounting for prices should look for the real growth measure and the period to which it applies.
Why a higher index number can mislead
Imagine two series that measure the same product. One sets its reference period at 100 when the product costs ₹50. Another starts later, when the price is ₹60. At a price of ₹66, the first index reads 132 and the second 110. The product on the shelf has exactly the same price in both examples.
A chart that joins 132 from the old scale directly to 110 from the new one would show a drop that never took place. Real revisions can involve other changes too, such as updated weights or coverage. Read the release notes before joining tables. If the publisher provides a consistent historical series, use it and label it clearly. Keep a visible break where comparable figures are unavailable.
Follow one factory order through the numbers
Consider a furniture maker that sells the same number of chairs as last year at a higher rupee price. Its sales revenue rises. The change in receipts alone cannot tell you that the workshop made more chairs. To describe physical activity, look for output measures with an appropriate industry breakdown. To describe what buyers paid, look for prices that match those buyers.
Now add delivery, design and repair services. They help explain why a broad economic measure and a factory output index can move at different rates. A national figure also covers far more activity than one company or one district. In a report on a local business, spell out what the company disclosed and use the national series as context.
Four details to put underneath the chart
Give the series name, reference period, unit and comparison period. An index level of 105 and a growth rate of five per cent answer different questions. Comparing October with September asks about one month. Comparing October with the previous October spans a year. A reader should be able to tell which calculation you used without opening a spreadsheet.
Finally, save the release date with the source table. If a later estimate changes, that date explains why an earlier presentation carried a different number. Bootpoot’s October consumer price report provides an example of a dated price release. The Mumbai conference is a chance to examine how the series are constructed. Its announcement itself supplies no new estimate of growth or inflation.
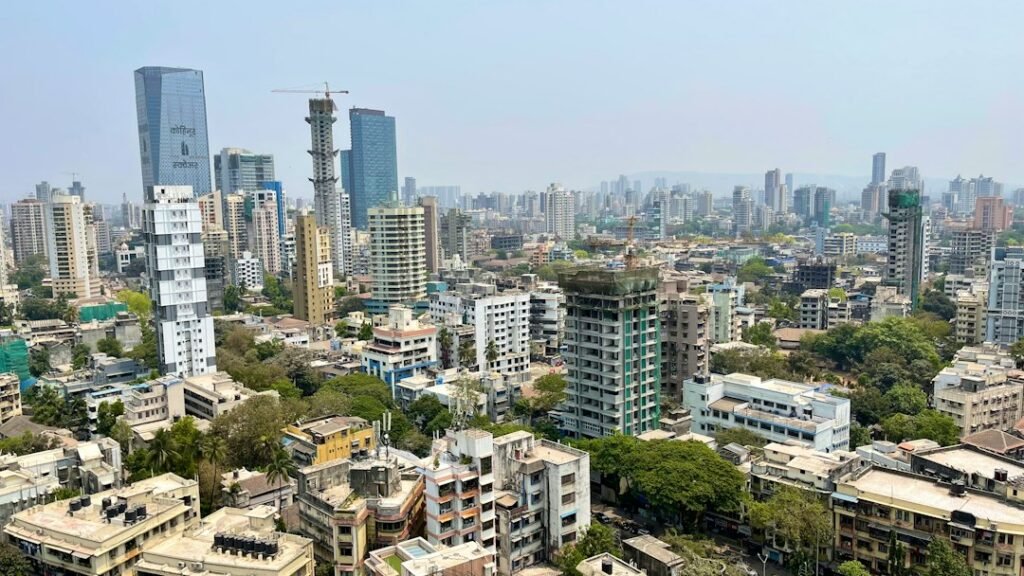
Illustrative photograph of Mumbai by Ameya Khandekar on Unsplash.