India Food Inflation October 2026: Why the 8.94% Figure Matters
India food inflation in October 2026 rose to 8.94% from 7.74% in September, according to the National Statistics Office. The provisional October figures put rural food inflation at 9.09% and urban food inflation at 8.68%. Both are year-on-year comparisons. The numbers tell you how food prices moved against the same month a year earlier.
The November 12 release shows why a food basket can feel more expensive even when a few familiar items cost less. Onion prices rose sharply in the national data. Potatoes and cauliflower moved in the other direction. What households and businesses buy determines how much of that pattern they feel.
India food inflation in October 2026 by item
Among the items highlighted in the release, onions were up 116.22% year on year, garlic was up 60.74%, ginger was up 48.32% and lemons were up 47.30%. Potato inflation was negative at 14.24% below the year-earlier level, and cauliflower was down 10.57%. These figures are national combined estimates. A market in one city can differ because its supply and prices can move on a different timetable.
Keep the comparison period in view. Onion inflation of 116.22% means the index for onions was more than twice its level a year earlier. September’s 108.13% was also a year-on-year number. Subtracting one inflation rate from the other gives a change in the rate, in percentage points. To work out the month-to-month change in prices, compare the underlying index levels for the same item.
Why the food rate differs from headline CPI
The overall Consumer Price Index includes other parts of household spending, such as transport, housing and education. The Consumer Food Price Index tracks food separately. In October, the headline CPI rate was 6.09%, while the food index rate was 8.94%. The separate food measure helps explain why someone who spends a large share of their budget on groceries can feel a bigger squeeze than the headline figure suggests.
The report also presents a food-and-beverages division under the headline CPI. Its 8.51% result belongs to that division. The 8.94% figure comes from the separate Consumer Food Price Index. Check the series name before copying a figure into a report or comparing it with a prior month. Bootpoot’s October CPI guide explains the broader release and the index base.
Rural and urban figures also answer different questions from the national one. If you compare a rural household’s grocery bill with the urban rate, you are changing both the place and the basket in the comparison. Start with the rural figure where appropriate, then check the release’s state tables before drawing a conclusion about a particular market.
How to compare the release with a grocery bill
Start with quantities. A receipt can be higher because the price per kilogram rose, because the family bought more, or because it switched to a different product. Pick several items you buy regularly and compare their unit prices with older receipts. The comparison is useful even if you have only a few receipts, as long as you keep the product and package size comparable.
A small restaurant can do the same with invoices. If onion costs have risen and potatoes are cheaper, the impact depends on how much of each goes into the dishes it sells. Track the cost per portion before drawing conclusions from the national average. The official release gives a benchmark for October, and its next monthly report will provide another reading on whether that pressure is persisting.
When saving the numbers for later, label October as provisional and September as final. That matters if you compare this report with a revised table next month.
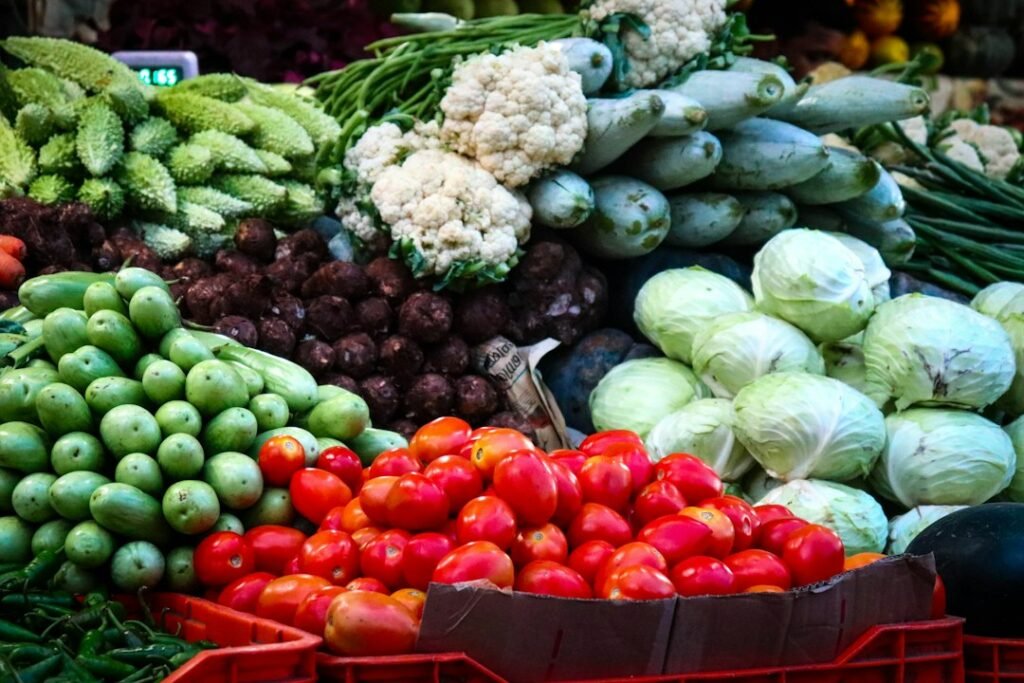
Illustrative photo by Nithin P John on Unsplash.